
In the dynamic landscape of modern marketing, data-driven decisions are no longer a luxury, but a necessity. A/B testing has emerged as a crucial tool for marketers to optimize campaigns, refine strategies, and ultimately, boost their return on investment (ROI). This powerful technique allows marketers to compare two versions of a marketing element, be it an email subject line, a call to action button, or even an entire landing page, to determine which performs better with their target audience. Understanding the intricacies of A/B testing is essential for any marketer aiming to stay ahead of the curve and maximize their impact. From website optimization to email marketing and paid advertising, A/B testing offers a scientific approach to improve conversions and achieve marketing objectives.
This article will delve into the core principles of A/B testing in marketing, providing a comprehensive guide to its implementation and interpretation. We will explore the key steps involved in setting up a successful A/B test, from formulating a hypothesis and defining your metrics to analyzing the results and implementing winning variations. Whether you are new to A/B testing or looking to refine your existing knowledge, this article will equip you with the insights and best practices needed to harness the full potential of this indispensable marketing tool and drive significant improvements in your campaigns. We will cover the significance of statistical significance, explore different A/B testing tools, and discuss common pitfalls to avoid. Gain a competitive edge by mastering the art of A/B testing and unlock the data-driven insights that can transform your marketing efforts.
Introduction to A/B Testing
A/B testing, also known as split testing, is a fundamental method in marketing for comparing two versions of something to determine which performs better. This “something” can be a webpage, an email subject line, an advertisement, or any other marketing element you want to optimize.
The process involves creating two variations (A and B) of a single variable. A percentage of your audience is randomly shown version A, while the remaining audience sees version B. Key metrics, such as conversion rates, click-through rates, or bounce rates, are then tracked and compared.
The version that yields the most favorable results, based on your pre-defined goals, is declared the winner and subsequently implemented. This iterative process allows for data-driven decision making and continuous improvement in marketing campaigns.
Selecting Variables to Test
Choosing the right variables to test is crucial for a successful A/B test. Focus on elements that directly impact your conversion goals. These could include aspects of your website, landing pages, emails, or advertisements.
Prioritize variables with the highest potential for improvement. Consider factors like bounce rate, click-through rate, and conversion rate to identify areas where changes might have the biggest impact.
Examples of testable variables:
- Headline: Try different wording, lengths, or emotional appeals.
- Call to action: Experiment with button color, text, and placement.
- Images/Videos: Test different visuals to see which resonates most with your audience.
- Form Length: Shorter forms can sometimes lead to higher conversion rates.
- Layout/Design: Changes in layout can improve user experience and engagement.
Limit the number of variables tested simultaneously. Testing too many variables at once can make it difficult to isolate the impact of each individual change. Focus on one or two key variables per test for clear, actionable results.
Setting Up Controlled Experiments
Setting up a controlled experiment, the core of A/B testing, involves several key steps. First, you must clearly define your objective. What are you trying to improve? Is it click-through rate, conversion rate, or average order value? A precise objective is crucial for accurate measurement and interpretation of results.
Next, identify the variable you wish to test. This might be a change in headline text, button color, call-to-action phrasing, or image placement. Only change one variable at a time to isolate its impact effectively. Creating variations of your original (the ‘A’ version) forms the ‘B’ (and ‘C’, ‘D’, etc.) versions for your test.
Then, split your audience into random groups. Each group is exposed to only one variation of your test. Ensure a statistically significant sample size for each group to ensure reliable results. Monitor the performance of each variation against your defined objective, collecting data over a predetermined period.
Finally, analyze the results. Determine which variation performed best and whether the difference in performance is statistically significant. Implement the winning variation to optimize your marketing efforts based on data-driven insights.
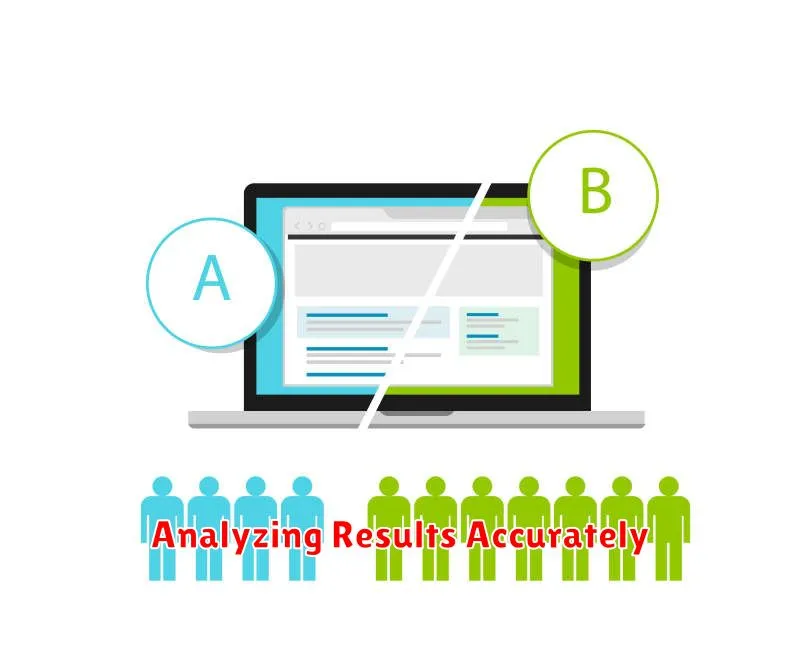
Analyzing Results Accurately
After concluding your A/B test, accurate analysis is crucial. This involves more than simply observing which version performed “better.” It requires a statistical understanding of whether the observed difference is significant and not due to random chance.
Statistical significance is key. Use a statistical significance calculator or a platform that provides this calculation automatically. Input the results from both versions (A and B) into the calculator to determine the p-value. A common threshold for statistical significance is a p-value of 0.05 or less. This indicates that there is a less than 5% probability that the observed difference between the versions is due to chance.
Consider the sample size. A larger sample size generally provides more reliable results. Insufficient data can lead to misleading conclusions.
Finally, analyze the practical significance. Even if a result is statistically significant, consider whether the difference is meaningful enough to warrant implementing the change. A small, statistically significant improvement may not be worth the effort of a complete overhaul if it doesn’t translate to a substantial impact on your business objectives.
Using Insights to Improve Strategy

A/B testing provides valuable data, but it’s the insights derived from this data that truly allow for strategy improvement. Analyzing test results goes beyond simply identifying the “winner.” It involves understanding why a particular variation performed better.
Consider these key areas when analyzing your A/B testing results:
- Statistical Significance: Ensure the observed difference isn’t due to random chance. A statistically significant result indicates a genuine impact.
- Effect Size: Quantify the magnitude of the difference between variations. A small improvement might not be worth implementing if the effort outweighs the gain.
- User Behavior: Dive deeper than conversion rates. Analyze heatmaps, scroll depth, and click-through rates to understand how users interacted with each variation.
By carefully examining these factors, you can pinpoint the elements that resonate with your target audience. This knowledge empowers you to refine your marketing strategies, optimize campaigns, and ultimately achieve better results.